fseventsd-runaway
fseventsd grew to 24 GB on my Mac, 800 times Apple’s own budget, and never recovered on its own
How to spot it, why it stays stuck after the load is gone, and how to fix it without a reboot.
macOS’s file-event daemon, fseventsd, grew to 24 GB on my MacBook Pro and kept one CPU core busy for two days. Apple’s own memory budget for it is 30 MB. The burst of file activity that set it off was over by then; the daemon never came back down. I run many AI coding agents on this machine, so here is what I measured, what I could not prove, and a check you can run yourself. I call it a leak below; strictly, it is memory that only grew.
TL;DR
- Spot it.
top -l 1 -stats pid,mem,cmprs,ports -pid $(pgrep -x fseventsd). A healthy daemon sits in single or low double-digit megabytes. Mine showed 24G, with 18G compressed. - Compare with Apple’s budget.
launchctl print system/com.apple.fseventsd | grep 'jetsam memory limit (active'prints a soft limit of 30 MB. Jetsam is the macOS memory-limit enforcer; a soft limit is not enforced by killing the process. - Do not wait for it to heal. The file-event flood subsided on 29 Sep. The daemon’s CPU use went up afterwards, to 97–98 % of a core for two days.
- Save evidence first.
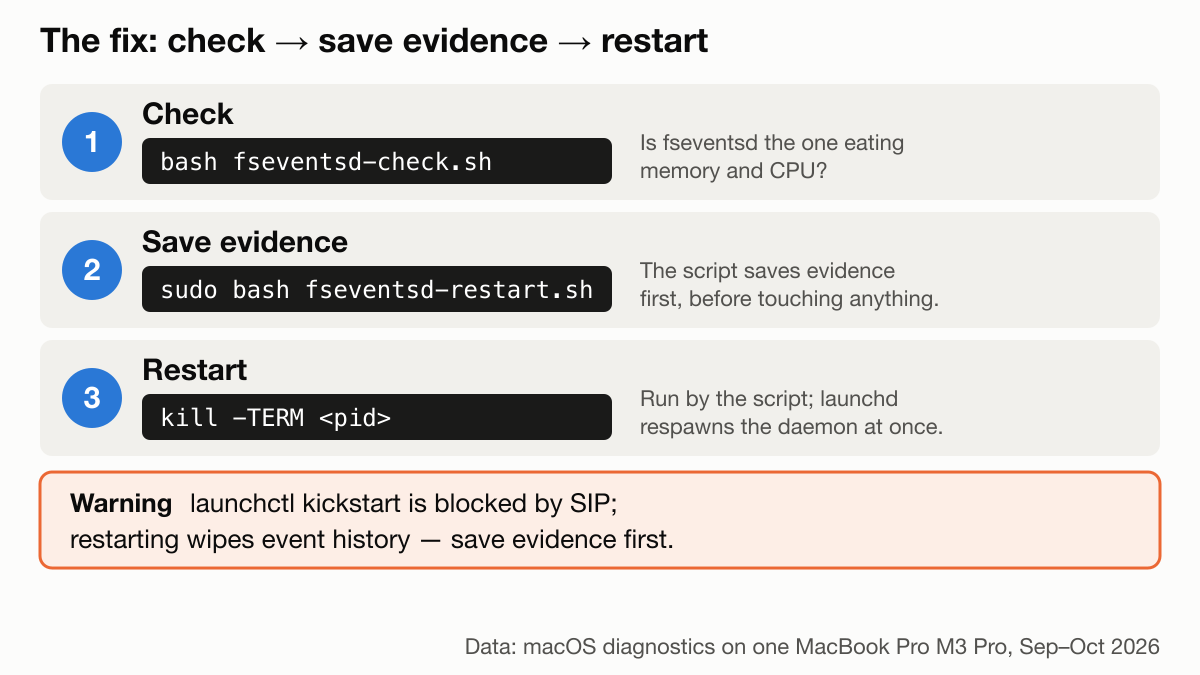
sudo ls -laT /System/Volumes/Data/.fseventsdandsudo sample $(pgrep -x fseventsd) 5. A restart erases the event history. - Fix without a reboot.
sudo kill -TERM $(pgrep -x fseventsd); if it does not die within ten seconds,sudo kill -9 $(pgrep -x fseventsd)(another user needed that at 8.9 GB). launchd respawns it at once.launchctl kickstart -kis refused by SIP (System Integrity Protection, which shields Apple’s services even from root).
Quick start
curl -fsSLO https://raw.githubusercontent.com/talkstream/fseventsd-runaway/main/fseventsd-check.sh
less fseventsd-check.sh && bash fseventsd-check.sh
No sudo, changes nothing, prints OK, WARN or RUNAWAY (exit code 0, 1 or 2; 3 if it cannot measure), --json for scripts and --fast to skip the 5-second CPU sample. fseventsd-restart.sh saves evidence, restarts the daemon and measures again; it refuses to restart if it could not save the evidence. Read it before running it with sudo.
For Claude Code users there is a plugin that runs the same check, memory only and in well under a second, at every session start, and stays silent while the daemon is healthy:
/plugin marketplace add talkstream/fseventsd-runaway
/plugin install fseventsd-health@fseventsd-runaway
1. Symptom
The machine is a 14-inch MacBook Pro, M3 Pro, 18 GB, macOS 27.0 (26A428), up 20 days 19 hours. It runs heavy agentic development: Claude Code sessions with subagents, Node, pnpm, vitest, Playwright, Python hooks, MCP servers, Docker through Colima. A saved top snapshot showed:
fseventsdat 121 % intop(several threads;psshowed 5 seconds of CPU per 5 seconds of wall time: one core, continuously), 57 hours of CPU time since boot.- Swap at 13,548 MB of 14,336 MB.
mediaanalysisdat 108 %,kernel_taskat 65 % andWindowServerat 42 %:fseventsdwas not the only busy process. Whykernel_taskwas busy, I do not know; Apple says it helps manage CPU temperature.
2. The suspect and Apple’s own 30 MB budget
fseventsd tells apps what changed on disk and keeps a persistent per-volume history of those events.
footprint reported 24 GB for the process, all of it “Malloc Small” (the heap class for small objects) in 8,162 regions. top agreed: 24G memory, 18G of it compressed.
Apple states the daemon’s budget in its launchd job:
$ launchctl print system/com.apple.fseventsd | grep 'jetsam memory limit (active'
jetsam memory limit (active, soft) = 30 MB
24 GB is about 800 times that. The limit is soft, so nothing acted on it.
3. Timeline: the load passed, the damage stayed
Apple’s own reports in /Library/Logs/DiagnosticReports let me rebuild the growth. Memory figures are as the tools print them, in binary units; Jetsam reports count 16 KB pages.
| When (GMT+7) | fseventsd memory | Source |
|---|---|---|
| 27 Sep 11:29 to 28 Sep 07:59 | 10 to 42 MB (normal) | disk-writes report |
| 28 Sep 10:15 | 0.04 GB | Jetsam event |
| 28 Sep 23:20 | 1,745 to 1,834 MB (about 1.7 GB) in about 2 min | cpu_resource report |
| 30 Sep 01:39 | 7.93 GB, the largest process on the Mac | Jetsam event |
| 30 Sep 06:27 | 11.17 GB | Jetsam event |
| 1 Oct 23:20 | 24 GB | footprint |
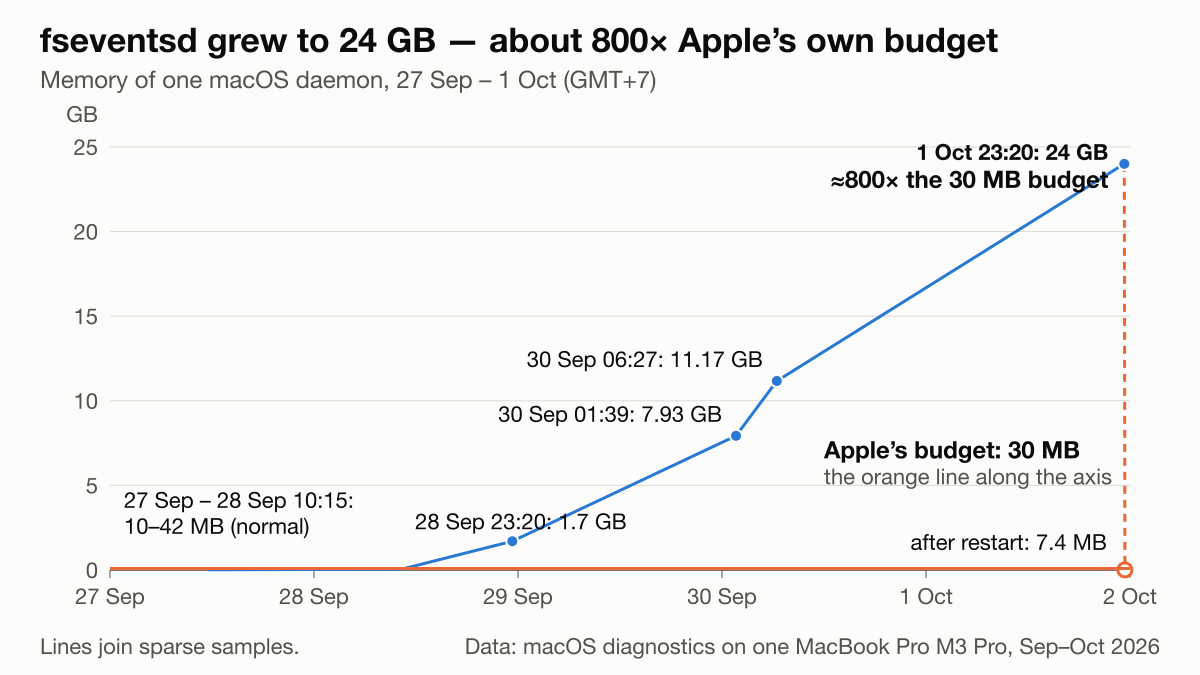
The same reports record the daemon’s CPU time, so I can compute what share of one core it used between them:
| Period | Share of one core |
|---|---|
| Boot (11 Sep) to 28 Sep 10:15 | 1.5 % |
| 28 Sep 10:15 to 30 Sep 01:39 | 16 % |
| 30 Sep 01:39 to 06:27 | 97 % |
| 30 Sep 06:27 to 1 Oct 23:00 | 98 % |
Now compare with the load. The history directory names each log file by a file-event ID, and the IDs only grow, so the gap between days gives events per day (tools/events_per_day.py). One exception: on 11 Sep, right after boot, the ID jumped by 4.7 billion in 11 minutes; that is a boot artefact, not events, so I leave that day out. On 14 to 21 Sep the Mac averaged about 50 to 200 events per second (12 and 13 Sep were higher, about 550 a second, and the daemon was still at 10 MB on 27 Sep). Then 479 on 22 Sep, 2,117 on 25 Sep, 4,694 on 27 Sep and 5,715 on 28 Sep: about 494 million events in one day, roughly 1.6 billion over the week. On 29 Sep it fell to 700, on 30 Sep it was 1,107. When I measured on 1 Oct, FSEventsGetCurrentEventId() advanced 195 events per second.
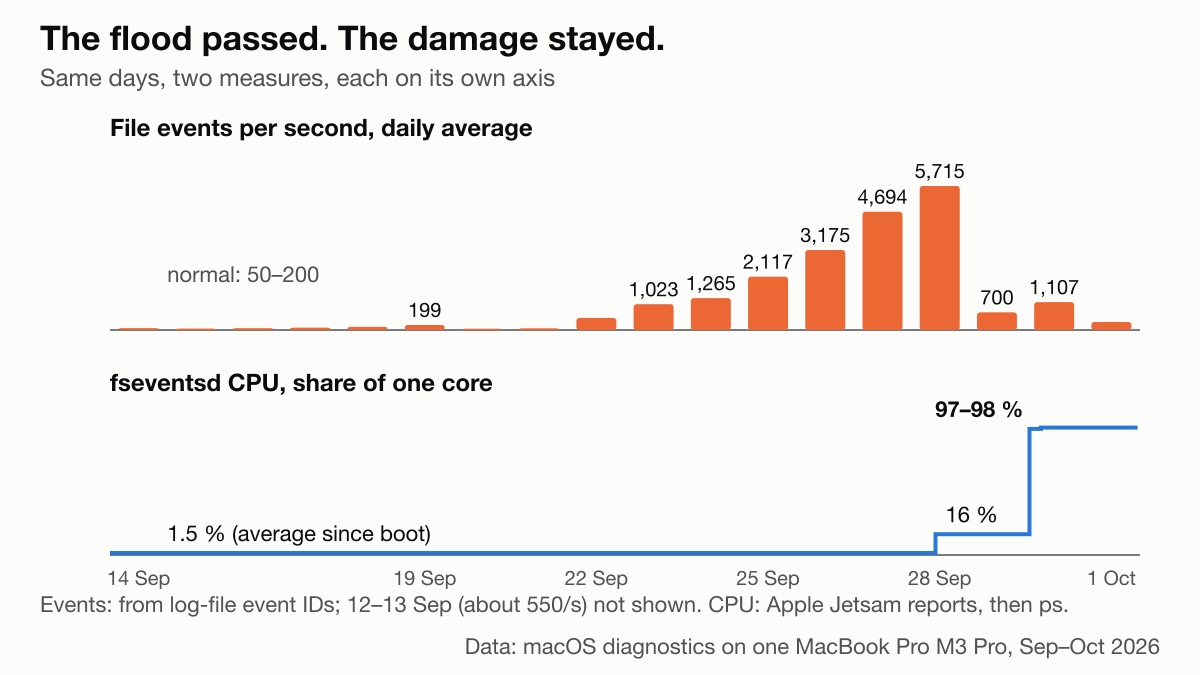
So the burst subsided on 29 Sep, and the daemon got more expensive after it: it averaged 16 % of a core from 28 Sep 10:15 to 30 Sep 01:39 (the peak day and the day after; a macOS report caught it at 63 % on 28 Sep 23:20), then 97 to 98 % from 30 Sep 01:39 on, while events fell to 700–1,107 per second. Memory went from 42 MB to 7.9 GB in under two days and kept climbing to 24 GB. Here, a burst pushed fseventsd into a state it did not leave on its own in the 46 hours I could see. Only a restart reset it.
macOS noticed and did nothing. The 28 Sep report says “90 seconds cpu time over 143 seconds (63% cpu average), exceeding limit of 50% cpu over 180 seconds”, then “Action taken: none”. It also shows ThermalPressure -> 0: no thermal throttling.
4. What it was doing
Sampled as root (sudo sample <pid> 5), the daemon had 17 threads. The hottest is the one that writes events to the on-disk log, com.apple.fseventsd.disklogger: 2,351 of its 2,526 samples (93 %) were inside _platform_strncmp, plain string comparison. The thread that delivers events to apps spent about half its samples waiting on a mutex (1,358 of 2,526) and 169 in the same string compare. A thread serving photolibraryd, which had just asked for history, was reading old logs (gzread) and waiting on a mutex too, at a different call site; whether it is the same lock, sample cannot show.
The disk-logger and delivery threads sit in the same internal function, whose samples show three things: a mutex lock, a string-compare loop and a malloc call. My reading, and it is only a reading because the binary is stripped: a lookup-or-insert over path strings that keeps growing. If that structure only grows, every new event costs a little more than the last. That would fit all three numbers at once: 24 GB of small allocations, CPU share rising after the load fell, and one core pinned by about 200 events per second.
It held only 176 Mach ports (kernel handles for talking to other processes), with lsmp -p <pid>. So the 24 GB is not thousands of live clients; it looks like accumulated state. Another user saw the same with a 36 GB daemon and “only around 375 mach ports” (daintree#12455).
5. Where did the flood come from?
The honest answer: several things were running, and I cannot say which one made 494 million events a day. The direct evidence, which paths the events were for, was in the event history, and the restart erased it (section 6). Here is what I checked.
- Agent activity. I counted every Claude Code tool call per day in my local transcripts, all sessions and subagents, unique by call ID (
tools/count_tool_calls.py). Against log files per day for 22 to 30 Sep, Pearson r = 0.71. Weak: agent activity was high on all nine days, and on 19 Sep 11,739 tool calls came with only 325 log files. Many of those calls were file reads and searches anyway. - Mutation testing. Stryker and mutmut runs appear in my transcripts from 24 Sep (
tools/count_mutation_runs.py): 63 on 24 Sep, 2 on 25 Sep, 25 on 26 Sep, 50 on 27 Sep, 37 on 28 Sep, 9 on 29 Sep, 33 on 30 Sep. 24 Sep had more runs than 27 Sep at a quarter of the event rate (1,265 against 4,694 per second). One Stryker run in one of my JS projects copies the project, 3,000 to 4,900 files depending on what it ignores, into a sandbox and deletes it afterwards. Copying the sandbox alone is thousands of file events per run, nowhere near hundreds of millions a day; what the hundreds of test runs inside each sandbox wrote, I did not count. The daily counts do not follow the flood, so it is a possible contributor, not a proven one. -
Docker through Colima. Colima mounted my whole home directory into the VM, writable, over virtiofs. That is the setup in colima#1569, where
fseventsdreached 28 GB. But the current Colima VM was created on 26 Sep at 00:55, after the flood had started, the only earlierdockercommands in my transcripts (18 and 23 Sep) failed because no Docker daemon was running. - A plugin selftest (measured on 3 Oct: a minor contributor at most). The selftest of ru-text, my own Claude Code plugin for Russian text, makes 113 fresh copies of the plugin tree per run. Measured on 3 Oct: one complete run took 180 seconds and produced 1,202,392 FSEvents, about 6,700 a second, against about 1,300 a second with no selftest running, so about 970,000 extra events per run. But it ran rarely: my transcripts show about 15 runs on 28 Sep (through its gate script: 11 times by hand, about 4 from my pre-push hook), at most 49 if every command that mentions it was a run. That is roughly 15 to 47 million of the 494 million events that day, a few percent and at most about a tenth. Not the flood.
Whatever the trigger, a system daemon should not hold 24 GB, or stay pinned after the load is gone.
6. Fix without reboot
The documented route is refused:
$ sudo launchctl kickstart -k system/com.apple.fseventsd
Could not kickstart service "com.apple.fseventsd": 150: Operation not permitted while System Integrity Protection is engaged
sudo kill -TERM <pid> worked. launchd respawned it at once, because its job is marked KeepAlive: new process at 23:21:01, 7.4 MB, under 1 % CPU. Others report sudo killall fseventsd fixing the same symptom (see Sources).
The restart wiped the event history: 93,494 files became 2. The best question, which paths made the flood, can no longer be answered. Collect evidence before you restart. FSEvents.h defines MustScanSubDirs, UserDropped and KernelDropped flags that tell clients to rescan after lost events; what my apps did with them, I did not check.
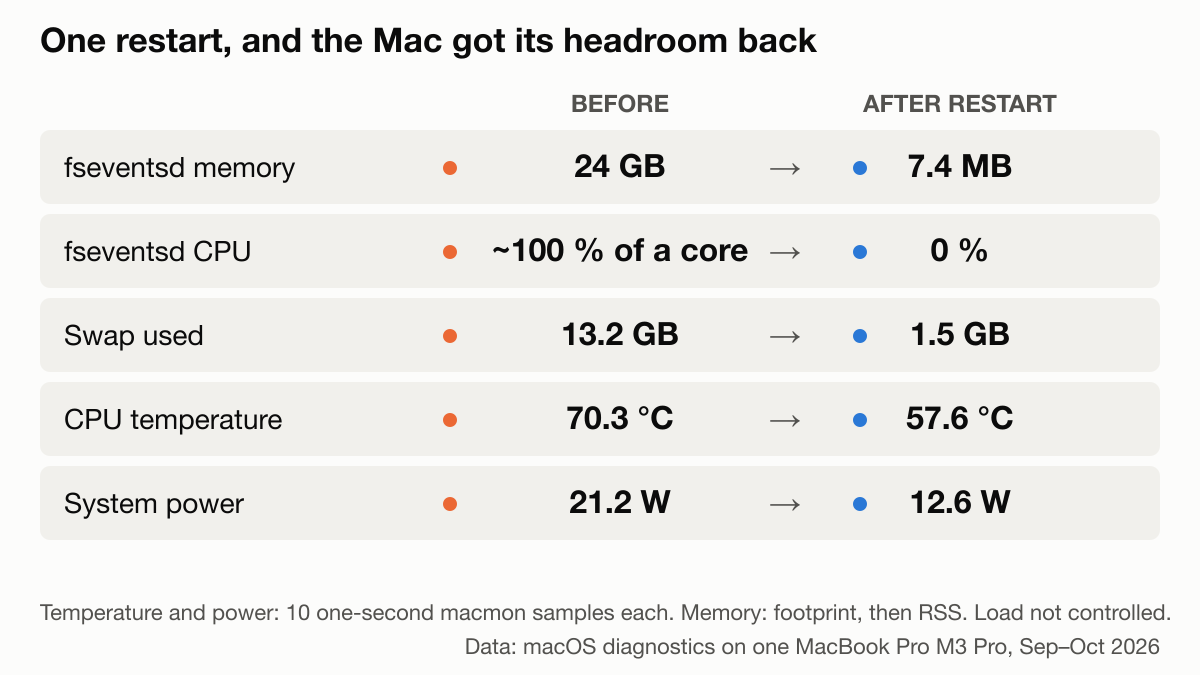
Swap used fell from 13,548 MB (of 14,336) to 1,533 MB (of 3,072). I restarted the daemon a second time while testing the restart script, then logged ten minutes (23:31 to 23:41): fseventsd stayed at 5 to 6 MB and 0 % CPU, CPU temperature had a median of 54.8 °C, system power 10.0 W.
7. Did it hurt the hardware?
SSD. smartctl -a disk0: Percentage Used 2 %, Available Spare 100 %, Media errors 0, 75.7 TB written (147,957,613 data units of 1,000 × 512 bytes), 2,620 power-on hours. Percentage Used is the vendor’s own estimate.
This boot wrote 8,012 GB, about 0.4 TB a day, and swap-outs were 4.2 TB of it: about half. Howard Oakley’s rule: swap under 10 % of writes contributes little to wear, and “If it’s 50% or higher, then having more physical memory would significantly reduce SSD wear” (source). I am at his upper line: worth watching, not an emergency. The swap figure includes earlier, unrelated memory incidents on this boot, so not all of it is fseventsd. If 2 % took 75.7 TB, 1 % of rated life takes roughly three months at this rate; that is an order of magnitude only, since Apple publishes no endurance figure.
Heat. Ten one-second macmon samples: before the restart CPU 70.3 °C on average, 21.2 W, fans 2,706 rpm of 6,800; after, 57.6 °C, 12.6 W, 2,409 rpm. Other processes were busy too, so this is a drop, not a controlled experiment. Apple’s operating range is ambient 10 to 35 °C, and above 35 °C ambient “can permanently damage battery capacity”. Reviewers’ stress tests of other M3 models reported about 100 °C at full load (Notebookcheck, via search snippets; not my machine and not an Apple figure).
Summary: the cost was swap, a busy core and a warmer machine, not a worn-out drive.
8. Prevention for agentic setups
- Check daily, or at every session start. Here the daemon went from 42 MB to 7.9 GB in under two days. Use
fseventsd-check.shfrom cron or launchd, or thefseventsd-healthplugin above. - Narrow container mounts. If you use Colima, mount only the folders you need instead of your whole home, as colima#1569 suggests.
- Batch heavy file churn. Mutation testing, sandbox copies and parallel test runs make many short-lived files. Prefer incremental modes and run them one project at a time.
- Fewer overlapping watchers. Watchman’s docs: avoid “multiple overlapping watches within the same filesystem tree”. Node’s
fs.watchuses FSEvents for directories, and libuv rebuilds its stream whenever watches change. If you build on FSEvents, exclude hot directories (node_modules,.git,dist); the API allows at most 8 exclusion paths per stream. - When the check goes red, restart the daemon instead of rebooting, after saving evidence.
9. What I could not prove
- The cause of the leak. The only public hypothesis (“leaks per-client state under register and unregister churn”) is marked “not proven” by its author, and the binary is stripped.
- Which processes or paths made the flood.
- What each app did after the restart.
- That 70 °C is “normal” for this chip: Apple publishes no throttle temperature.
Reported to Apple as FB25046068: a system daemon at 800 times its own budget that does not recover. On the Claude Code side, detection and fewer FSEvents registrations are requested in claude-code#98769. If you see the same pattern, add your numbers to the issues below.
10. Tools and sources
Tools: macmon 0.8.2 (sudoless Apple Silicon monitor), fswatch 1.22.0, smartmontools 7.5, and the built-in top, footprint, sample, lsmp, launchctl. The counting scripts are in tools/.
Sources:
- daintree#12455: 36 GB
fseventsd, hypothesis “not proven”. - colima#1569:
fseventsdup to 28 GB with the home directory mounted writable. - claude-code#96008 and #72394:
fseventsdnear 100 % CPU, fixed bysudo killall fseventsd. - claude-code#19566: Claude Code registers many FSEvents watchers.
- Watchman troubleshooting: “too many event stream clients”.
- Howard Oakley on swap and SSD lifetime.
- Apple: operating temperature, kernel_task, battery, and
FSEvents.hin the macOS SDK.
11. Follow-up, 2–3 Oct: hot again, and it was not fseventsd
A day after the fix the Mac got hot again, right after a “simple” new task in Claude Code. fseventsd-check.sh said OK, and it was right.
- The daemon stayed healthy. After the restart I installed macOS 27.0.1 and rebooted, so this is a new build and a fresh process. The hourly watch log then shows 16 checks over 42 hours (gaps while the Mac slept), all OK, at 4.6 to 5.5 MB.
- Including under heavy parallel CPU load. In that window one session ran eight agents in parallel, started together at 19:16. Between 19:17 and 21:40 the session fetched 61 short videos (two more near midnight) and decoded at least 58 of them in software into contact sheets. Three hourly checks fell inside that window: 4.9 to 5.1 MB, all OK. The event log (log-file IDs as in section 3, listing read as root) shows that this run was not a file-event flood: 22 to 190 events per second per hour in that window, an ordinary rate, against 5,715 per second on the flood day.
- Most likely the heat was that workload itself. The daemon was fine throughout, and the next evening, with no heavy local jobs running, 30 two-second
macmonsamples gave a median CPU temperature of 43.4 °C, 9.3 W of system power and fans at 0 rpm. - An independent data point. Another user’s two Macs had
fseventsdat about 6 MB, one of them with 31 mostly idle headlessclaudeprocesses piled up (comment on #98769); whether those processes held FSEvents streams is unconfirmed. They did not reproduce the leak there, and heavy CPU work at ordinary event rates did not reproduce it here. The 1 Oct leak came after days of flood and then did not recover. That is consistent with the after-effect described in section 3, not proof of a mechanism.
If your Mac runs hot, run the check first. If it says OK, look for the real load with top -o power instead of restarting the daemon. For agent setups, run heavy local steps (video, transcription, mutation tests, builds) in one queue, not one per agent, and decode video in hardware (-hwaccel videotoolbox).
A note on measurement: on macOS 27, macmon’s cpu_power reads 0 W, and once in 300 samples it jumped to 3,564 W (macmon#76). I use only its temperature, system power and fan readings, and report medians for the longer series: the spike also inflates system power, which macmon reports as the larger of the SMC reading and the sum of CPU, GPU and ANE power.
12. Follow-up, 30–31 Oct: it came back, and what I learned
By my logs the daemon stayed small for 28 days, then went from 15 MB to 3.3 GB in about 30 hours on macOS 27.0.1. Full numbers are in my comment on claude-code#98769, which also credits the reports this builds on.
- Rate does not explain the onset. The onset hour had 1.24 M log records; earlier hours reached 4.04 M with no growth.
- Before some point it drains by itself. One rise to 146 MB went back to 15 MB with the same pid. A threshold on memory alone would have restarted it for nothing.
- Moving temp files to another volume does not help, not even with
.fseventsd/no_log, which the daemon honoured. At the same count it grew as much as the Data volume or more: 25 and 27 MB per 50,000 files withno_log, 23 and 27 without, against 7 and 28. So it does not look like it is in writing the on-disk log. - Reusing file names helps only partly, about 30 % in my test.
- An unattended restart worked once. A small root LaunchDaemon checks launchd’s pid for the job, tries to save evidence and restarts with TERM, then KILL if needed. First live run: 4,045 MB to about 5 MB in 16 s, on its 4 GB path, which my own test had pushed it to. Installed on 31 Oct, so this shows the mechanism and not the long run.
So far I can slow this down and recover from it without a reboot. I cannot prevent it, and the cause in the daemon stays unproven.
MIT licensed. Measurements from one machine; your numbers will differ.